
In 2023, inflation is hitting every type of goods and service and the costs of Halloween is not immune to the increase in prices. The spookiest time of the year can come with some expense and the price of trick-or-treat candy for consumers has increased across the country.
The Scholaroo’s data team took a look at the Halloween candy price index from 2020 to the present and analyzed price changes across all 50 states. Here is what they discovered in Arizona, as well as the other 50 states.
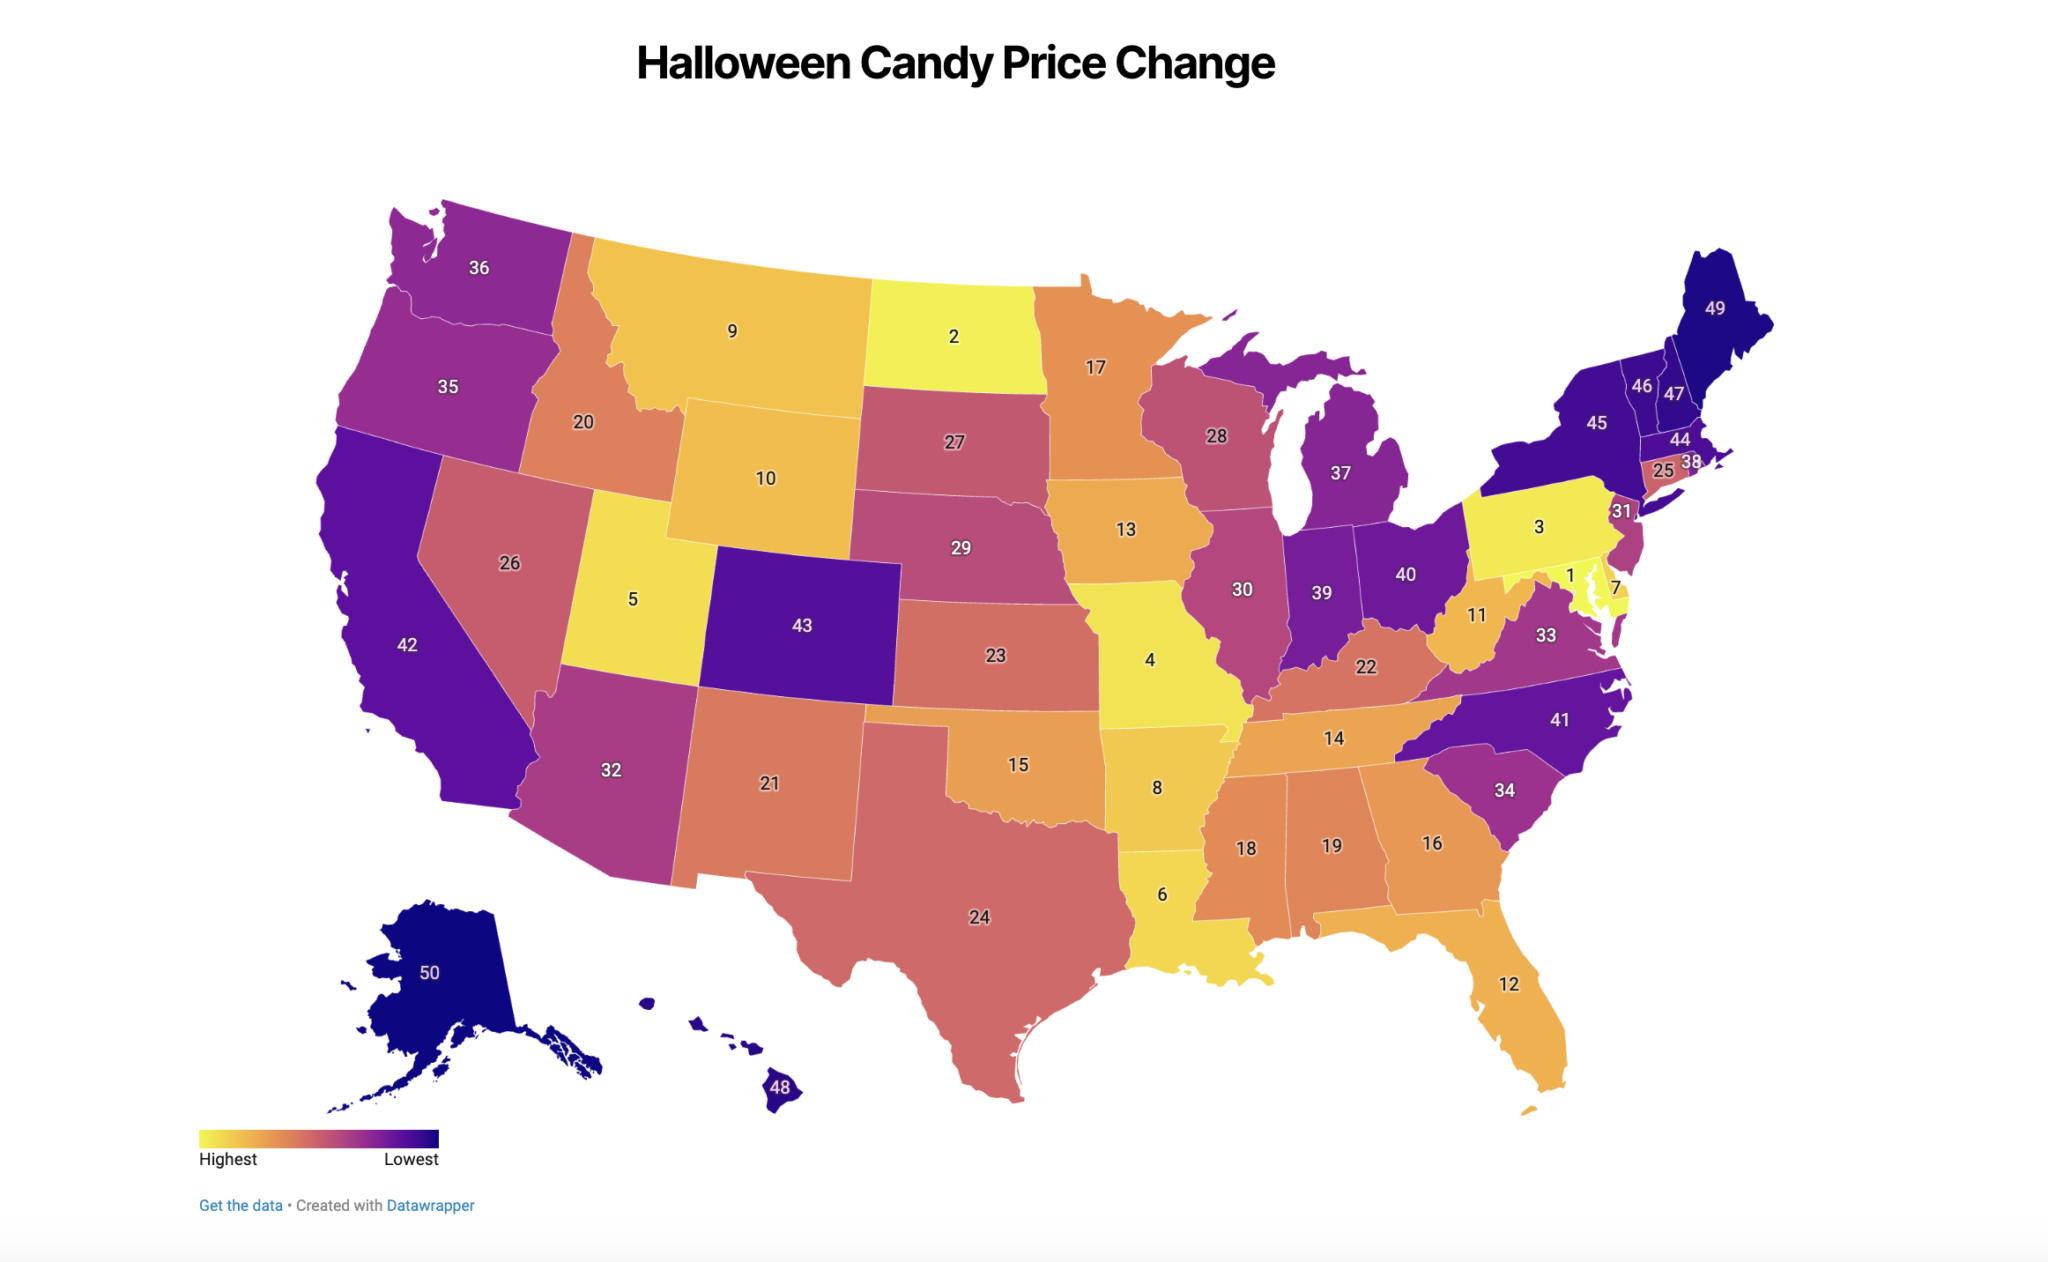
Image provided by Scholaroo
Maryland has experienced the highest Halloween candy price change from 2020 to the present, with Alaska having the smallest Halloween candy price increase. Arizona comes in towards the bottom of all the states in price increase over the last 3 years.
Halloween candy spending is expected to reach $3.6 billion, which is up from $3.1 billion last year.
| State | Halloween Candy Price Change Last Year | Halloween Candy Price Change Over the Last 3 Years |
| Maryland | 13.56% | 40.18% |
| Pennsylvania | 13.15% | 38.92% |
| New Jersey | 12.30% | 34.58% |
| Maine | 12.29% | 30.56% |
| Vermont | 11.93% | 32.01% |
| New Hampshire | 11.90% | 31.66% |
| Delaware | 11.78% | 37.67% |
| New York | 11.50% | 32.21% |
| Utah | 11.23% | 37.94% |
| Conneticut | 11.10% | 35.79% |
| North Dakota | 11.01% | 39.21% |
| Oklahoma | 10.97% | 36.86% |
| Texas | 10.91% | 35.90% |
| New Mexico | 10.89% | 36.05% |
| West Virginia | 10.85% | 37.12% |
| Nevada | 10.81% | 35.69% |
| Missouri | 10.74% | 38.26% |
| Montana | 10.73% | 37.38% |
| Florida | 10.47% | 37.11% |
| Alabama | 10.46% | 36.28% |
| Masssachusetts | 10.38% | 32.32% |
| Tennessee | 10.33% | 36.88% |
| Mississippi | 10.33% | 36.48% |
| Iowa | 10.32% | 36.99% |
| Louisiana | 10.27% | 37.71% |
| Arkansas | 10.15% | 37.52% |
| South Dakota | 10.04% | 35.66% |
| Georgia | 10% | 36.83% |
| Wyoming | 9.95% | 37.15% |
| Minnesota | 9.59% | 36.68% |
| Kentucky | 9.58% | 35.96% |
| Rhode Island | 9.55% | 33.69% |
| Nebraska | 9.28% | 34.97% |
| Idaho | 9.21% | 36.09% |
| South Carolina | 9.06% | 34.24% |
| California | 8.99% | 32.75% |
| Ohio | 8.78% | 33.62% |
| Illinois | 8.75% | 34.77% |
| Indiana | 8.51% | 33.69% |
| Kansas | 8.49% | 35.96% |
| Virginia | 8.45% | 34.44% |
| North Carolina | 8.42% | 33.53% |
| Wisconsin | 8.39% | 35.32% |
| Arizona | 7.92% | 34.51% |
| Michigan | 7.79% | 33.85% |
| Hawaii | 7.70% | 30.80% |
| Washington | 7.53% | 34.08% |
| Oregon | 7.44% | 34.14% |
| Colorado | 7.30% | 32.59% |
| Alaska | 5.64% | 30.28% |
This Halloween, 73% of people plan to celebrate Halloween and the average spend per person related to Halloween is expected to be $108.24 per person. Overall, consumers in the United States is expected to spend $12.2 Billion for 2023 Halloween.
How People Plan to Celebrate Halloween
Carve a pumpkin – 46%
Hand out candy – 68%
Decorate Their Home – 53%
Dress Up – 50%
Throw/Attend a party – 32%
Total Expected Halloween Spending in 2023:
Costumes – $4.1B
Candy – $3.6B
Decorations – $3.9B
Greeting Cards – $.5B
However you plan to celebrate on Tuesday, have a spooky, safe time!