

For employees, a return-to-office mandate means facing the reality of the dreaded daily commute.
Whether it’s companies like Amazon, Facebook, or even Zoom, businesses are tightening their return-to-office policies across the country. As a result, employees used to working from home are now scrambling to carve out more time in their day to commute to work.
A recent study calculated a price tag on all the time you spend commuting to work. Two Phoenix-area cities are among the costliest in the nation.
But what is the actual cost of a commute for those who find themselves trapped in traffic without getting paid for it?
In order to find out, we analyzed the average daily and yearly cost of commuting in 170 cities across the country. To determine the amount of lost wages while commuters sit in traffic, our analysis compared the average commute time in each city with the median income for full-time, year-round workers.
Key Findings
- Both Peoria and Gilbert made the top 25 cities in the U.S. with the costliest commutes.
Peoria landed at No. 23 on the list with an annual commute cost of $7,622.98; Gilbert ranked No. 24 at $7,353.07. - San Francisco has the costliest average annual commute. Commuters in The Golden City can expect to lose an average of $12,650.66 in wages due to sitting in traffic each year.
- Nationwide, commuters experience an average annual wage loss of $5,748.05, which is equivalent to $22.11 per day.
- New York City has the longest commute, with an average round trip time of 1 hour and 20 minutes, costing workers roughly $41.66 per day, or $10,831.74 annually.
Which cities have the most expensive commutes?
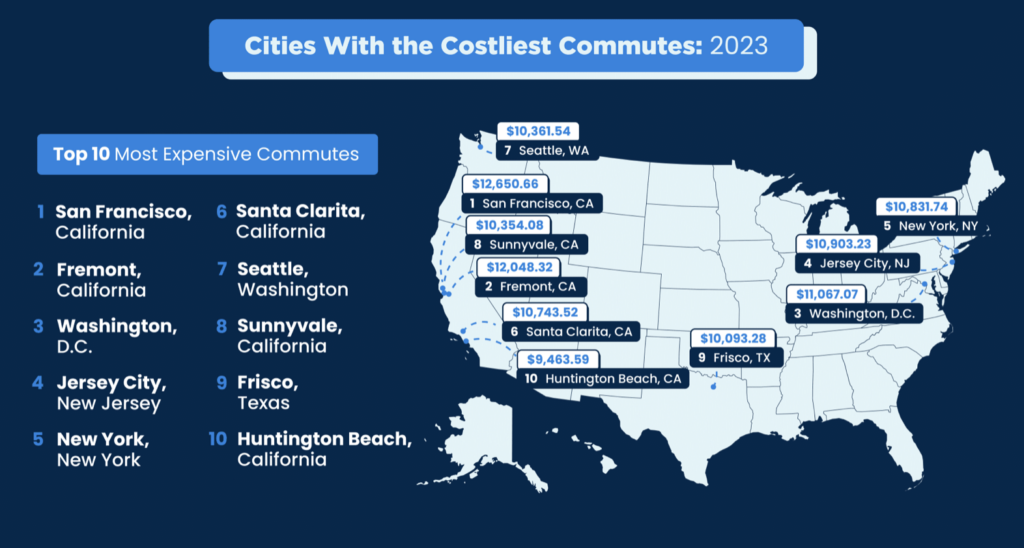
When it comes to the most expensive commutes, cities on the East and West Coasts dominate the top 10 list.
On the West Coast, two Bay Area cities, San Francisco and Fremont, claim the spots for the nation’s most costly commutes. In San Francisco, commuters face an average wage loss of $12,650, while Fremont commuters lose an average of $12,048.
Elsewhere, Washington, D.C. ranks third for the most expensive commute, with an average annual loss of $11,067 for its commuters. Following closely, Jersey City ranks 4th ($10,903), and nearby New York City completes the top 5 ($10,831).
Cities With the Costliest Commutes: 2023
City |
State | Median Earnings for Full-Time Workers | Average Hourly Wage | Average Commute (Round Trip) | Daily Commute Cost | Annual Commute Cost | |
| 1 | San Francisco | California | $103,978.00 | $49.99 | 58.4 | $48.66 | $12,650.66 |
| 2 | Fremont | California | $104,768.00 | $50.37 | 55.2 | $46.34 | $12,048.32 |
| 3 | Washington | District of Columbia | $93,855.00 | $45.12 | 56.6 | $42.57 | $11,067.07 |
| 4 | Jersey City | New Jersey | $76,964.00 | $37.00 | 68.0 | $41.94 | $10,903.23 |
| 5 | New York | New York | $65,317.00 | $31.40 | 79.6 | $41.66 | $10,831.74 |
| 6 | Santa Clarita | California | $77,664.00 | $37.34 | 66.4 | $41.32 | $10,743.52 |
| 7 | Seattle | Washington | $94,554.00 | $45.46 | 52.6 | $39.85 | $10,361.54 |
| 8 | Sunnyvale | California | $125,504.00 | $60.34 | 39.6 | $39.82 | $10,354.08 |
| 9 | Frisco | Texas | $92,106.00 | $44.28 | 52.6 | $38.82 | $10,093.28 |
| 10 | Huntington Beach | California | $85,066.00 | $40.90 | 53.4 | $36.40 | $9,463.59 |
| 11 | Irvine | California | $91,246.00 | $43.87 | 47.4 | $34.66 | $9,010.54 |
| 12 | Alexandria | Virginia | $83,799.00 | $40.29 | 51.6 | $34.65 | $9,008.39 |
| 13 | Rancho Cucamonga | California | $66,479.00 | $31.96 | 65.0 | $34.62 | $9,002.36 |
| 14 | Boston | Massachusetts | $72,077.00 | $34.65 | 57.2 | $33.04 | $8,589.18 |
| 15 | McKinney | Texas | $73,314.00 | $35.25 | 56.0 | $32.90 | $8,553.30 |
| 16 | Yonkers | New York | $62,061.00 | $29.84 | 65.8 | $32.72 | $8,507.53 |
| 17 | Oakland | California | $71,364.00 | $34.31 | 56.6 | $32.37 | $8,415.01 |
| 18 | San Jose | California | $82,570.00 | $39.70 | 48.8 | $32.29 | $8,394.62 |
| 19 | Chicago | Illinois | $62,010.00 | $29.81 | 64.4 | $32.00 | $8,319.68 |
| 20 | Elk Grove | California | $69,733.00 | $33.53 | 57.0 | $31.85 | $8,280.79 |
| 21 | Cary | North Carolina | $84,833.00 | $40.79 | 45.4 | $30.86 | $8,023.79 |
| 22 | Hayward | California | $60,020.00 | $28.86 | 62.6 | $30.11 | $7,827.61 |
| 23 | Peoria | Arizona | $62,831.00 | $30.21 | 59.0 | $29.70 | $7,722.98 |
| 24 | Gilbert | Arizona | $72,725.00 | $34.96 | 48.8 | $28.44 | $7,393.71 |
| 25 | Palmdale | California | $49,157.00 | $23.63 | 71.8 | $28.28 | $7,353.07 |
Top five cities with the costliest commutes
#1. San Francisco, California
Average Commute: 4 minutes
Daily Commute Cost:$48.66
Yearly Commute Cost:$12,650.66
#2. Fremont, California
Average Commute: 2 minutes
Daily Commute Cost:$46.34
Yearly Commute Cost:$12,048.32
#3. Washington, D.C.
Average Commute: 6 minutes
Daily Commute Cost:$42.57
Yearly Commute Cost:$11,067.07
#4. Jersey City, New Jersey
Average Commute: 1 hour and 8 minutes
Daily Commute Cost:$41.94
Yearly Commute Cost:$10,903.23
#5. New York, New York
Average Commute: 1 hour and 20 minutes
Daily Commute Cost:$41.66
Yearly Commute Cost:$10,831.74
Overall, commuters in nine out of the top 10 cities lose an average of $10,000 worth of wages or more per year on commuting. That’s nearly twice as much as the nationwide cost for commuters, which is $5,748 per year, or $22.11 per day. According to our analysis, 59 cities are above the nationwide average cost to commute.
The cheapest commuting cities can be found in Jackson, Mississippi ($2,535); Lubbock, Texas ($2,832); Springfield, Missouri ($2,870); Fayetteville, North Carolina ($3,014) and Brownsville, Texas ($3,140).
As the debate over remote work versus return-to-office continues, it’s important for small business owners to recognize that commuting goes beyond financial implications—it can also affect employee well-being and productivity.
Creating a work environment that prioritizes flexibility can have positive benefits for both your business as well as your employees.